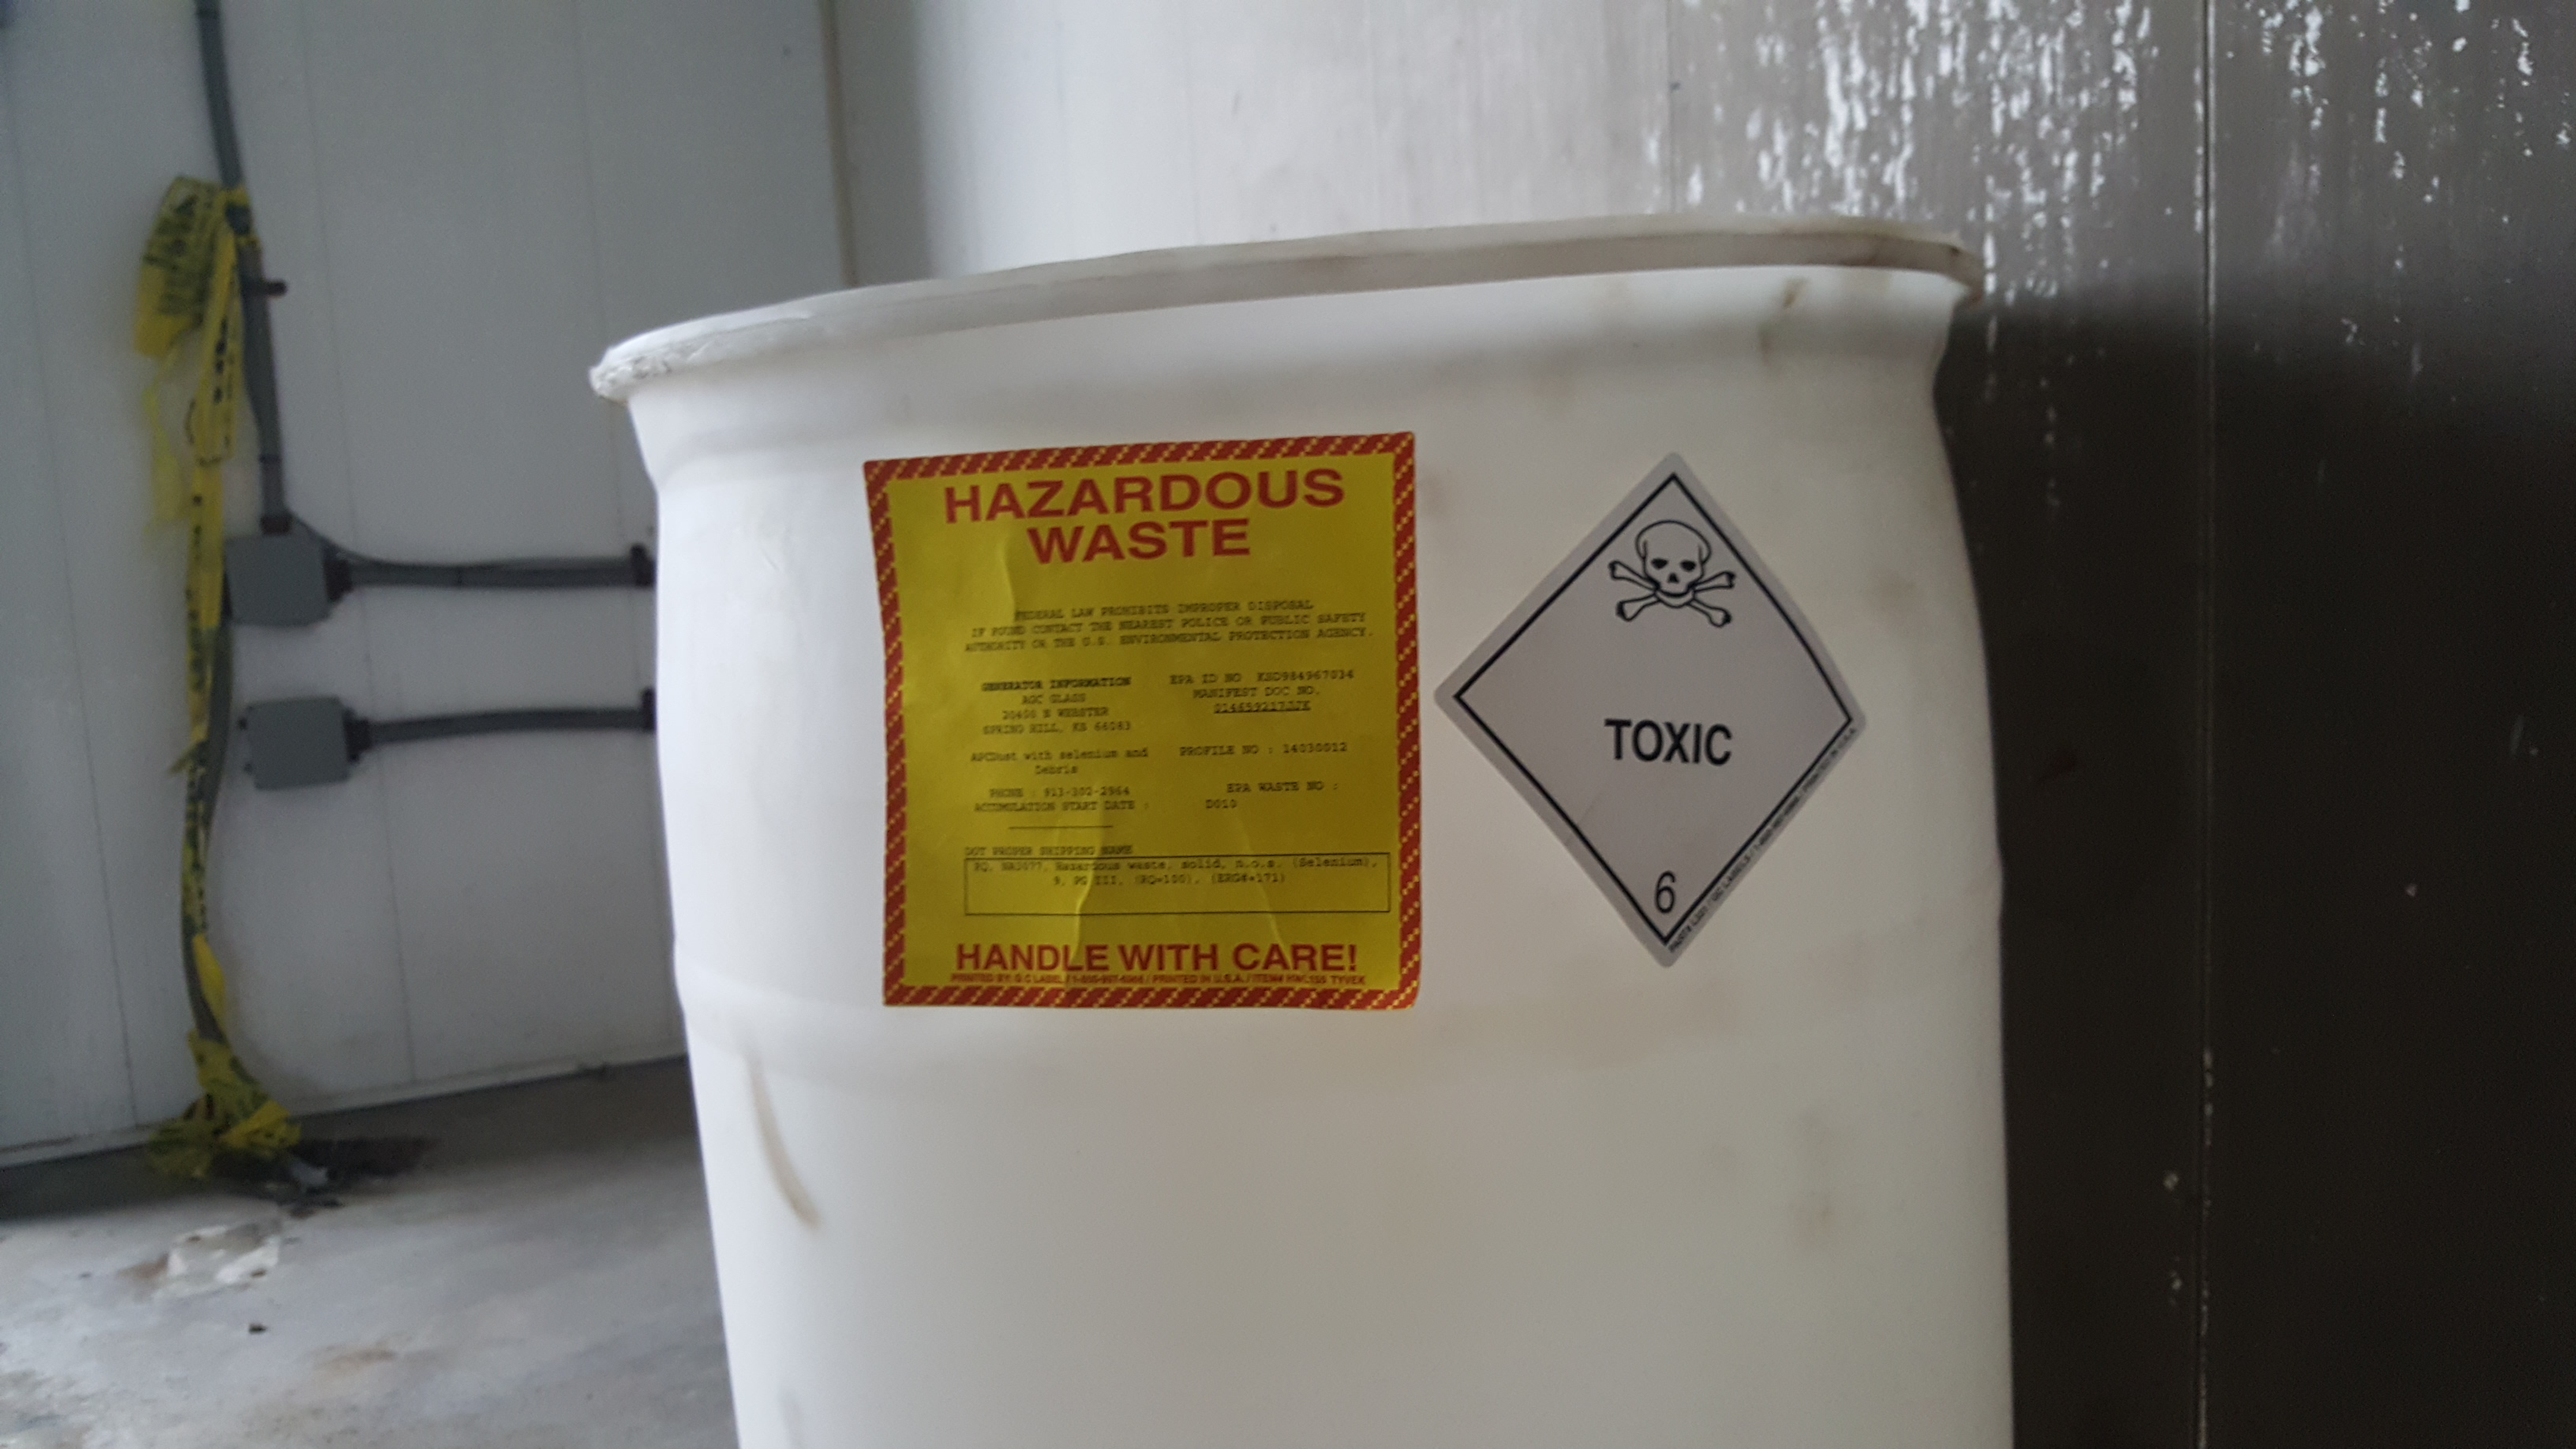
Well, maybe this question is “Frequently Asked” but I found this data in a presentation created by the US Environmental Protection Agency and thought it might be of interest to all of you. Below is tabulated according to generator type of the number of hazardous waste generators, the amount of hazardous waste they generate, and the percent of total amount of hazardous waste generated it represents.
[table “HazWasteGens” not found /]Not sure of your hazardous waste generator status? Take this short survey |

